Data processing for image-based profiling
![]()
![]()
Pycytominer is a toolkit for processing high dimensional readouts from high-throughput image-based profiling experiments. The tool is most often used for processing data through the following pipeline:
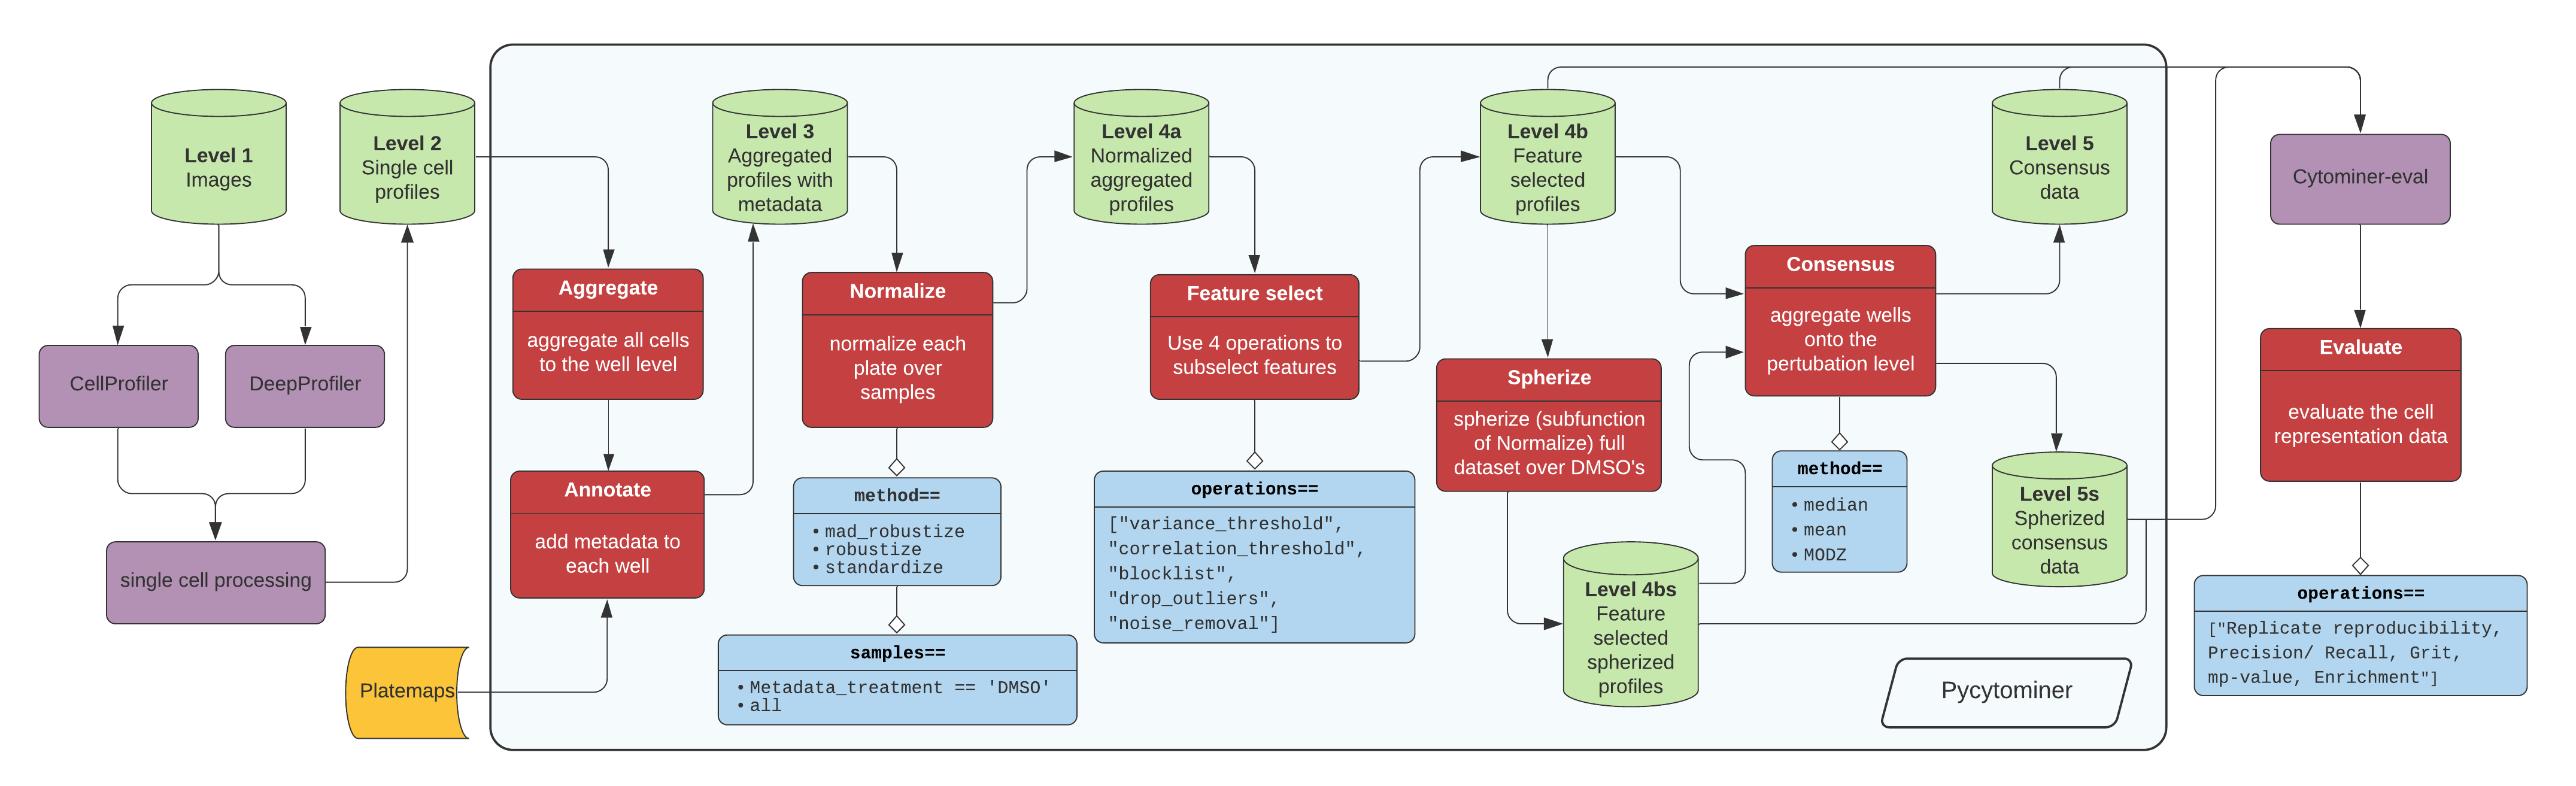
Figure 1. The standard image-based profiling experiment and the role of Pycytominer. (A) In the experimental phase, a scientist plates cells, often perturbing them with chemical or genetic agents and performs microscopy imaging. In image analysis, using CellProfiler for example, a scientist applies several data processing steps to generate image-based profiles. In addition, scientists can apply a more flexible approach by using deep learning models, such as DeepProfiler, to generate image-based profiles. (B) Pycytominer performs image-based profiling to process morphology features and make them ready for downstream analyses. (C) Pycytominer performs five fundamental functions, each implemented with a simple and intuitive API. Each function enables a user to implement various methods for executing operations.
Click here for high resolution pipeline image
Image data flow from a microscope to cell segmentation and feature extraction tools (e.g. CellProfiler or DeepProfiler) (Figure 1A). From here, additional single cell processing tools curate the single cell readouts into a form manageable for Pycytominer input. For CellProfiler, we recommend CytoTable for harmonizing outputs before Pycytominer processing. Some legacy workflows use cytominer-database ([DEPRECATED]), including the CSV collation utilities described below. For DeepProfiler, we include single cell processing tools in pycytominer.cyto_utils.
Next, Pycytominer performs reproducible image-based profiling (Figure 1B). The Pycytominer API consists of five key steps (Figure 1C). The outputs generated by Pycytominer are utilized for downstream analysis, which includes machine learning models and statistical testing to derive biological insights.
The best way to communicate with us is through GitHub Issues, where we are able to discuss and troubleshoot topics related to Pycytominer.
Please see our CONTRIBUTING.md for details about communicating possible bugs, new features, or other information.
Installation
You can install Pycytominer using the following platforms.
This project follows a <major>.<minor>.<patch> semantic versioning scheme which is used for every release with small variations per platform.
pip (link):
# install pycyotminer from PyPI
pip install pycytominer
conda (link):
# install Pycytominer from conda-forge
conda install -c conda-forge pycytominer
Docker Hub (link):
Container images of Pycytominer are made available through Docker Hub.
These images follow a tagging scheme that extends our release sematic versioning which may be found within our CONTRIBUTING.md Docker Hub Image Releases documentation.
# pull the latest Pycytominer image and run a module
docker run --platform=linux/amd64 cytomining/pycytominer:latest python -m pycytominer.<modules go here>

# pull a commit-based version of Pycytominer (b1bb292) and run an interactive bash session within the container
docker run -it --platform=linux/amd64 cytomining/pycytominer:pycytominer-1.1.0.post16.dev0_b1bb292 bash

# pull a scheduled update of pycytominer, map the present working directory to /opt within the container, and run a python script.
docker run -v $PWD:/opt --platform=linux/amd64 cytomining/pycytominer:pycytominer-1.1.0.post16.dev0_b1bb292_240417 python /opt/script.py
Frameworks
Pycytominer is primarily built on top of pandas, also using aspects of SQLAlchemy, sklearn, and pyarrow.
Pycytominer currently supports Apache Parquet, Parquet dataset directories, compressed text (e.g. .csv.gz), and anndata (through the extra pip install pycytominer[anndata] and is limited to h5ad or zarr) input and output data.
CellProfiler inputs
Pycytominer supports data generated by CellProfiler and includes defaults that match common CellProfiler data structures and naming conventions. Pycytominer can process appropriately structured CellProfiler outputs directly. We recommend harmonizing CellProfiler outputs with CytoTable before using Pycytominer for most workflows (e.g., CellProfiler -> CytoTable -> Pycytominer). For a CellProfiler-specific example, see the CytoTable CellProfiler-to-Parquet tutorial. For a broader overview, see the CytoTable mise en place guide.
CellProfiler-generated image-based profiles typically consist of two main components:
Metadata features: This section contains information about the experiment, such as plate ID, well position, incubation time, perturbation type, and other relevant experimental details. These feature names are prefixed with
Metadata_, indicating that the data in these columns contain metadata information.Morphology features: These are the quantified morphological features prefixed with the default compartments (
Cells_,Cytoplasm_, andNuclei_). Pycytominer also supports non-default compartment names (e.g.,Mito_).
Harmonizing inputs from other image analysis tools
We recommend harmonizing data using CytoTable when working with data from image analysis tools such as CellProfiler or In Carta, or legacy data systems such as cytominer-database. We built CytoTable to help prepare data for Pycytominer and include many presets to help you get started with your work (please also check out our CytoTable paper).
When Parquet-backed CytoTable or CytoDataframe inputs include OME-Arrow image payload columns, Pycytominer still supports numeric Image_* measurements when you request image features.
At the same time, inferred Image_* features are limited to numeric columns, and normalize() only accepts numeric feature columns.
Non-normalized image payload columns are preserved in normalized outputs rather than being transformed.
This lets Pycytominer analyze image-level measurements without trying to normalize nested image payload data stored alongside them.
If you are using Pycytominer with other tools or data systems, please file an issue to reach out. We’d love to hear from you so that we can learn how to best support broad and multiple use-cases.
API
Pycytominer has five major processing functions:
Aggregate - Average single-cell profiles based on metadata information (most often “well”).
Annotate - Append metadata (most often from the platemap file) to the feature profile
Normalize - Transform input feature data into consistent distributions
Feature select - Exclude non-informative or redundant features
Consensus - Average aggregated profiles by replicates to form a “consensus signature”
The API is consistent for each of these functions:
# Each function takes as input a pandas DataFrame or file path
# and transforms the input data based on the provided options and methods
df = function(
    profiles_or_path,
    features,
    samples,
    method,
    output_file,
    additional_options...
)
Each processing function has unique arguments, see our documentation for more details.
Usage
The default way to use Pycytominer is within python scripts, and using Pycytominer is simple and fun.
The example below demonstrates how to perform normalization with a dataset generated by CellProfiler.
# Real world example
import pandas as pd
import pycytominer

commit = "da8ae6a3bc103346095d61b4ee02f08fc85a5d98"
url = f"https://media.githubusercontent.com/media/broadinstitute/lincs-cell-painting/{commit}/profiles/2016_04_01_a549_48hr_batch1/SQ00014812/SQ00014812_augmented.csv.gz"

df = pd.read_csv(url)

normalized_df = pycytominer.normalize(
    profiles=df,
    method="standardize",
    samples="Metadata_broad_sample == 'DMSO'"
)
For CytoTable warehouse layouts, you can either load the profile table directory directly with load_profiles() or use the convenience helper load_cytotable_profiles():
from pycytominer import normalize
from pycytominer.cyto_utils import load_cytotable_profiles, load_profiles

profiles_from_root_df = load_profiles(
    "path/to/warehouse_root"
)

profiles_from_helper_df = load_cytotable_profiles(
    "path/to/warehouse_root",
    table_name="joined_profiles",
)

normalized_df = normalize(
    profiles=profiles_from_helper_df.assign(
        Metadata_treatment=[
            "control" if image_number % 2 == 0 else "drug"
            for image_number in profiles_from_helper_df["Metadata_ImageNumber"]
        ]
    ),
    samples="Metadata_treatment == 'control'",
    method="standardize",
)
Command Line Interface (CLI) usage
Pycytominer also provides a simple CLI for file-based workflows. The Pycytominer CLI calls single Pycytominer functions that read profiles from disk, perform a specific operation with provided arguments, and write outputs to disk without requiring a dedicated python file.
Before using the CLI, keep in mind the following conventions:
The CLI is intended for file-based execution of the core processing functions:
aggregate,annotate,normalize,feature_select, andconsensus.Arguments that map to Python lists (for example
--features,--strata,--replicate_columns, and--operation) should be passed as comma-delimited strings.The CLI executes one Pycytominer function per command and writes results to disk. For full pipeline orchestration, chain commands in your workflow manager.
Output format is controlled by
--output_type(for exampleparquet); this is not inferred from the filename extension.
# Aggregate profiles (note the parquet output type)
pycytominer aggregate \
  --profiles path/to/profiles.csv.gz \
  --output_file path/to/profiles_aggregated.parquet \
  --output_type parquet \
  --strata Metadata_Plate,Metadata_Well \
  --features Cells_AreaShape_Area,Cytoplasm_AreaShape_Area

# Annotate profiles with platemap metadata
pycytominer annotate \
  --profiles path/to/profiles_aggregated.parquet \
  --platemap path/to/platemap.csv \
  --output_type parquet \
  --output_file path/to/profiles_augmented.parquet \
  --join_on Metadata_well_position,Metadata_Well

# Normalize profiles
pycytominer normalize \
  --profiles path/to/profiles_augmented.csv.gz \
  --output_file path/to/profiles_normalized.parquet \
  --output_type parquet \
  --features Cells_AreaShape_Area,Cytoplasm_AreaShape_Area \
  --meta_features Metadata_Plate,Metadata_Well \
  --samples "Metadata_treatment == 'control'" \
  --method standardize

# Feature selection
pycytominer feature_select \
  --profiles path/to/profiles_normalized.parquet \
  --output_file path/to/profiles_feature_selected.parquet \
  --output_type parquet
  --features Cells_AreaShape_Area,Cytoplasm_AreaShape_Area \
  --operation variance_threshold,correlation_threshold

# Form consensus profiles
pycytominer consensus \
  --profiles path/to/profiles_feature_selected.csv.gz \
  --output_file path/to/profiles_consensus.parquet \
  --output_type parquet \
  --replicate_columns Metadata_Plate,Metadata_Well \
  --features Cells_AreaShape_Area,Cytoplasm_AreaShape_Area \
  --operation median
Other functionality
We included some custom tools in pycytominer/cyto_utils that provides other functionality:
CellProfiler CSV collation
If running your images on a cluster, unless you have a MySQL or similar large database set up then you will likely end up with lots of different folders from the different cluster runs (often one per well or one per site), each one containing an Image.csv, Nuclei.csv, etc.
In order to look at full plates, therefore, we first need to collate all of these CSVs into a single file (currently SQLite) per plate.
We can do this with a library called cytominer-database.
However, please use caution as cytominer-database is a deprecated tool.
If you want to perform this data collation inside Pycytominer using the cyto_utils function collate (and/or you want to be able to run the tests and have them all pass!), you will need cytominer-database==0.3.4; this will change your installation commands slightly:
# Example for general case commit:
pip install "pycytominer[collate]"

# Example for specific commit:
pip install "pycytominer[collate] @ git+https://github.com/cytomining/pycytominer@77d93a3a551a438799a97ba57d49b19de0a293ab"
If using pycytominer in a conda environment, in order to run collate.py, you will also want to make sure to add cytominer-database=0.3.4 to your list of dependencies.
Creating a cell locations lookup table
The CellLocation class offers a convenient way to augment a LoadData file with X,Y locations of cells in each image.
The locations information is obtained from a single cell SQLite file.
To use this functionality, you will need to modify your installation command, similar to above:
# Example for general case commit:
pip install "pycytominer[cell_locations]"
Example using this functionality:
metadata_input="s3://cellpainting-gallery/test-cpg0016-jump/source_4/workspace/load_data_csv/2021_08_23_Batch12/BR00126114/test_BR00126114_load_data_with_illum.parquet"
single_single_cell_input="s3://cellpainting-gallery/test-cpg0016-jump/source_4/workspace/backend/2021_08_23_Batch12/BR00126114/test_BR00126114.sqlite"
augmented_metadata_output="~/Desktop/load_data_with_illum_and_cell_location_subset.parquet"

python \
    -m pycytominer.cyto_utils.cell_locations_cmd \
    --metadata_input ${metadata_input} \
    --single_cell_input ${single_single_cell_input}   \
    --augmented_metadata_output ${augmented_metadata_output} \
    add_cell_location

# Check the output

python -c "import pandas as pd; print(pd.read_parquet('${augmented_metadata_output}').head())"

# It should look something like this (depends on the width of your terminal):

#   Metadata_Plate Metadata_Well Metadata_Site  ...                                   PathName_OrigRNA ImageNumber                                        CellCenters
# 0     BR00126114           A01             1  ...  s3://cellpainting-gallery/cpg0016-jump/source_...           1  [{'Nuclei_Location_Center_X': 943.512129380054...
# 1     BR00126114           A01             2  ...  s3://cellpainting-gallery/cpg0016-jump/source_...           2  [{'Nuclei_Location_Center_X': 29.9516027655562...
Generating a GCT file for morpheus
The software morpheus enables profile visualization in the form of interactive heatmaps.
Pycytominer can convert profiles into a .gct file for drag-and-drop input into morpheus.
# Real world example
import pandas as pd
import pycytominer

commit = "da8ae6a3bc103346095d61b4ee02f08fc85a5d98"
plate = "SQ00014812"
url = f"https://media.githubusercontent.com/media/broadinstitute/lincs-cell-painting/{commit}/profiles/2016_04_01_a549_48hr_batch1/{plate}/{plate}_normalized_feature_select.csv.gz"

df = pd.read_csv(url)
output_file = f"{plate}.gct"

pycytominer.cyto_utils.write_gct(
    profiles=df,
    output_file=output_file
)
Citing Pycytominer
If you use pycytominer in your project, please cite our software.
You can see citation information in the ‘cite this repository’ link at the top right under about section within GitHub.
This information may also be referenced within the CITATION.cff file.
Contents: